All work
F
Ferrous · B2B · Front-end build
Cutting the time to acknowledge an alert by 48%
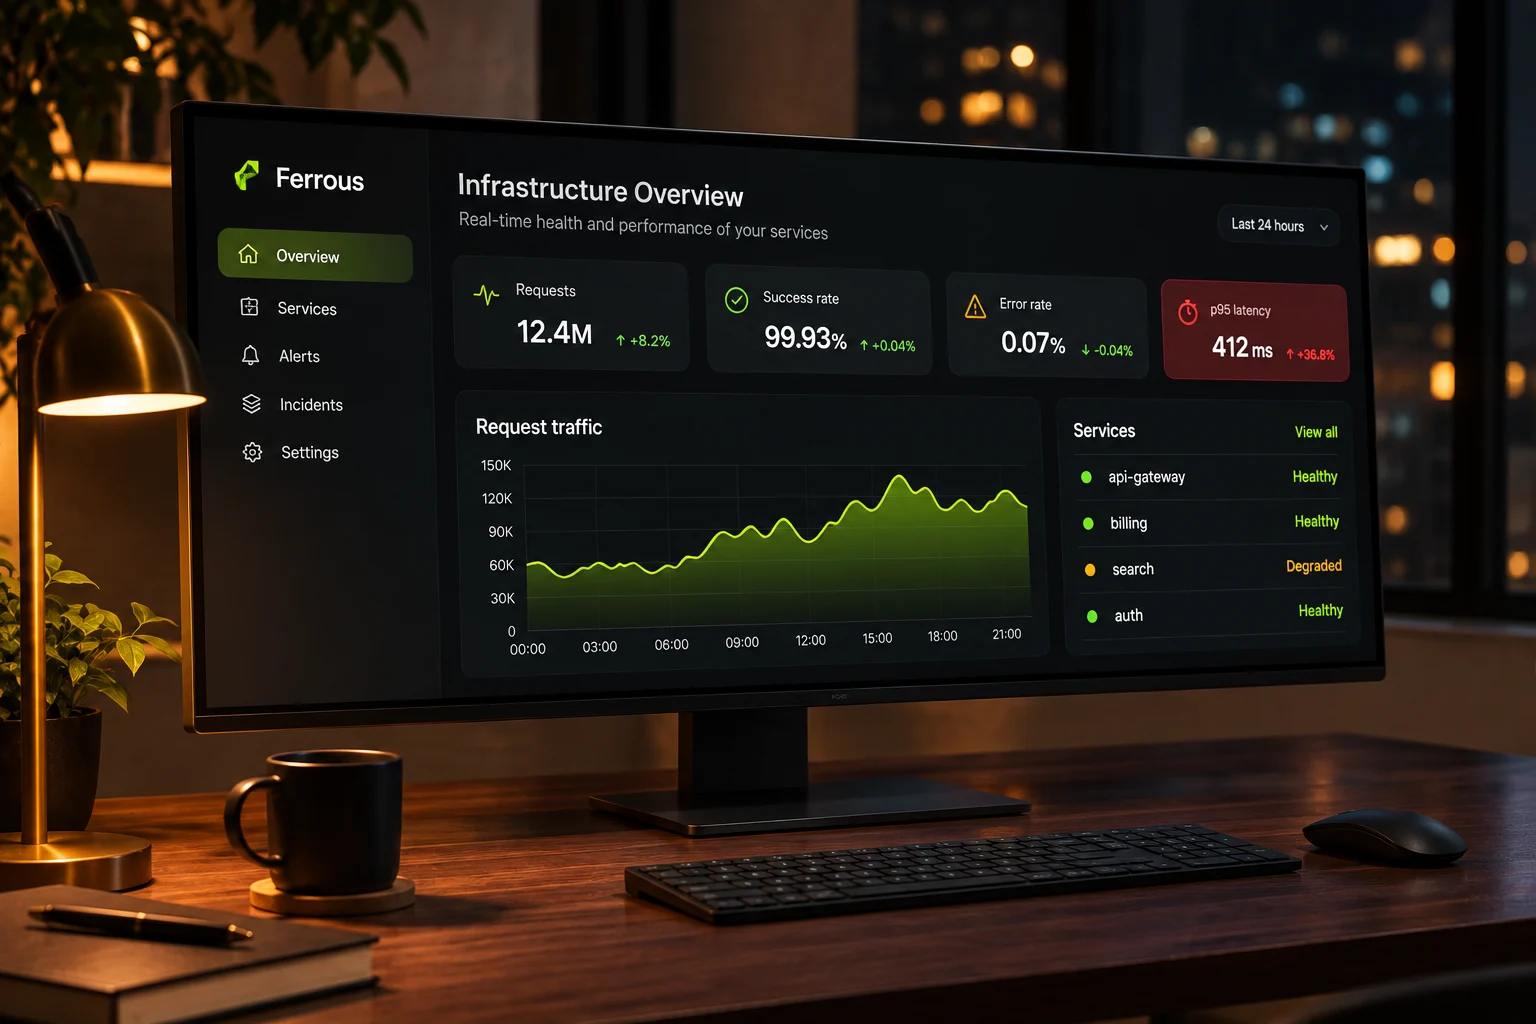
Ferrous is an infrastructure monitoring platform that 600 engineering teams use to watch their services, traffic and incidents.
My role
Front-end lead and interface design
Team
1 designer-engineer, 4 engineers, 1 PM
Timeline
12 weeks · 2025
Platform
Web console and on-call app
Overview
Make the console readable at 3 a.m.
01
The challenge
On-call engineers were paged at night and landed on thirty charts of equal weight. Finding what was broken took minutes they did not have.
02
The goal
Show what is broken, who owns it and what changed on one screen, and let the on-call engineer acknowledge from their phone.
03
My role
I redesigned the overview and alert views, then rebuilt the console front end in React and TypeScript with the platform team.
01 · The problem
Thirty charts and no answer
Ferrous grew by adding a chart for every new metric. The overview had thirty panels of equal weight, and the alert list was sorted by time, not by impact.
Incident reviews kept finding the same pattern: the signal was on screen, but engineers spent the first minutes of every incident looking for it.
9 min
median time to acknowledge an alert
30
charts on the overview screen
41%
of night alerts escalated to a second engineer
02 · Research
Replaying twenty real incidents
With the reliability team I replayed twenty past incidents minute by minute, marking where engineers looked, what they clicked and when they understood the problem.
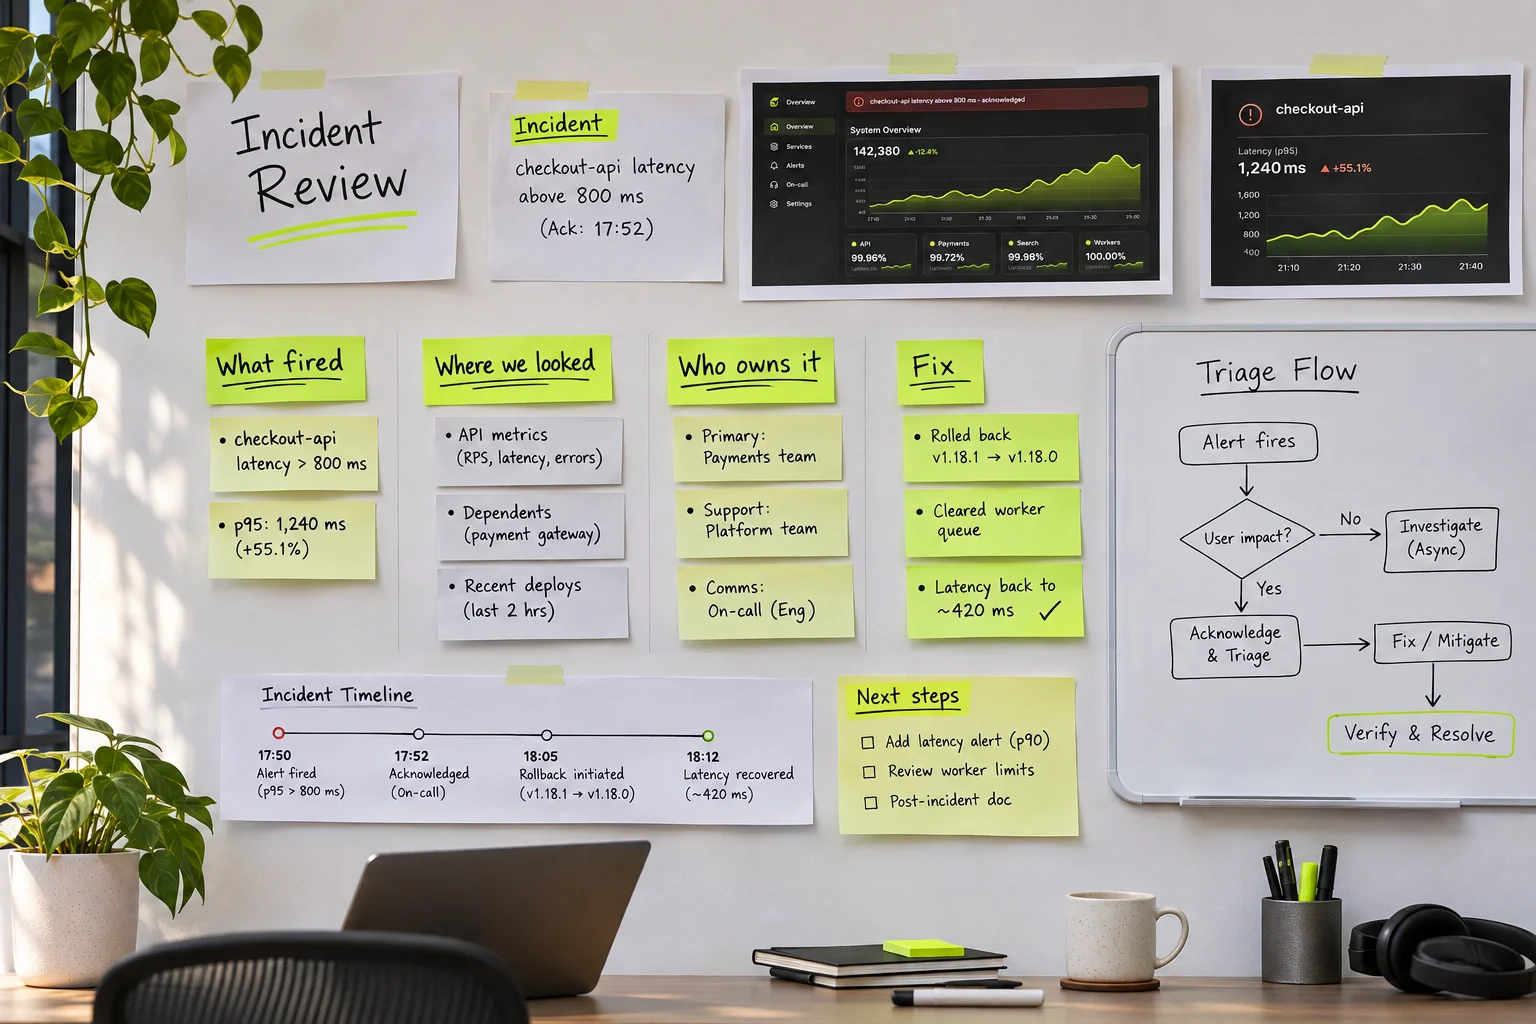
Incident timelines and the triage flow sketched during the review sessions.
What we learned
Insight 01
Impact beats recency
Engineers wanted the alert that affects customers first, not the newest one.
Insight 02
Ownership is the first question
Before fixing anything, people needed to know which team owns the failing service.
Insight 03
Night eyes need contrast
Low-contrast grey charts were hard to read on a dimmed screen, half asleep.
03 · The solution
One screen that answers what, who and since when
The overview now leads with an incident banner, one traffic chart and four health tiles. Alerts are sorted by impact, and every row names its owner.
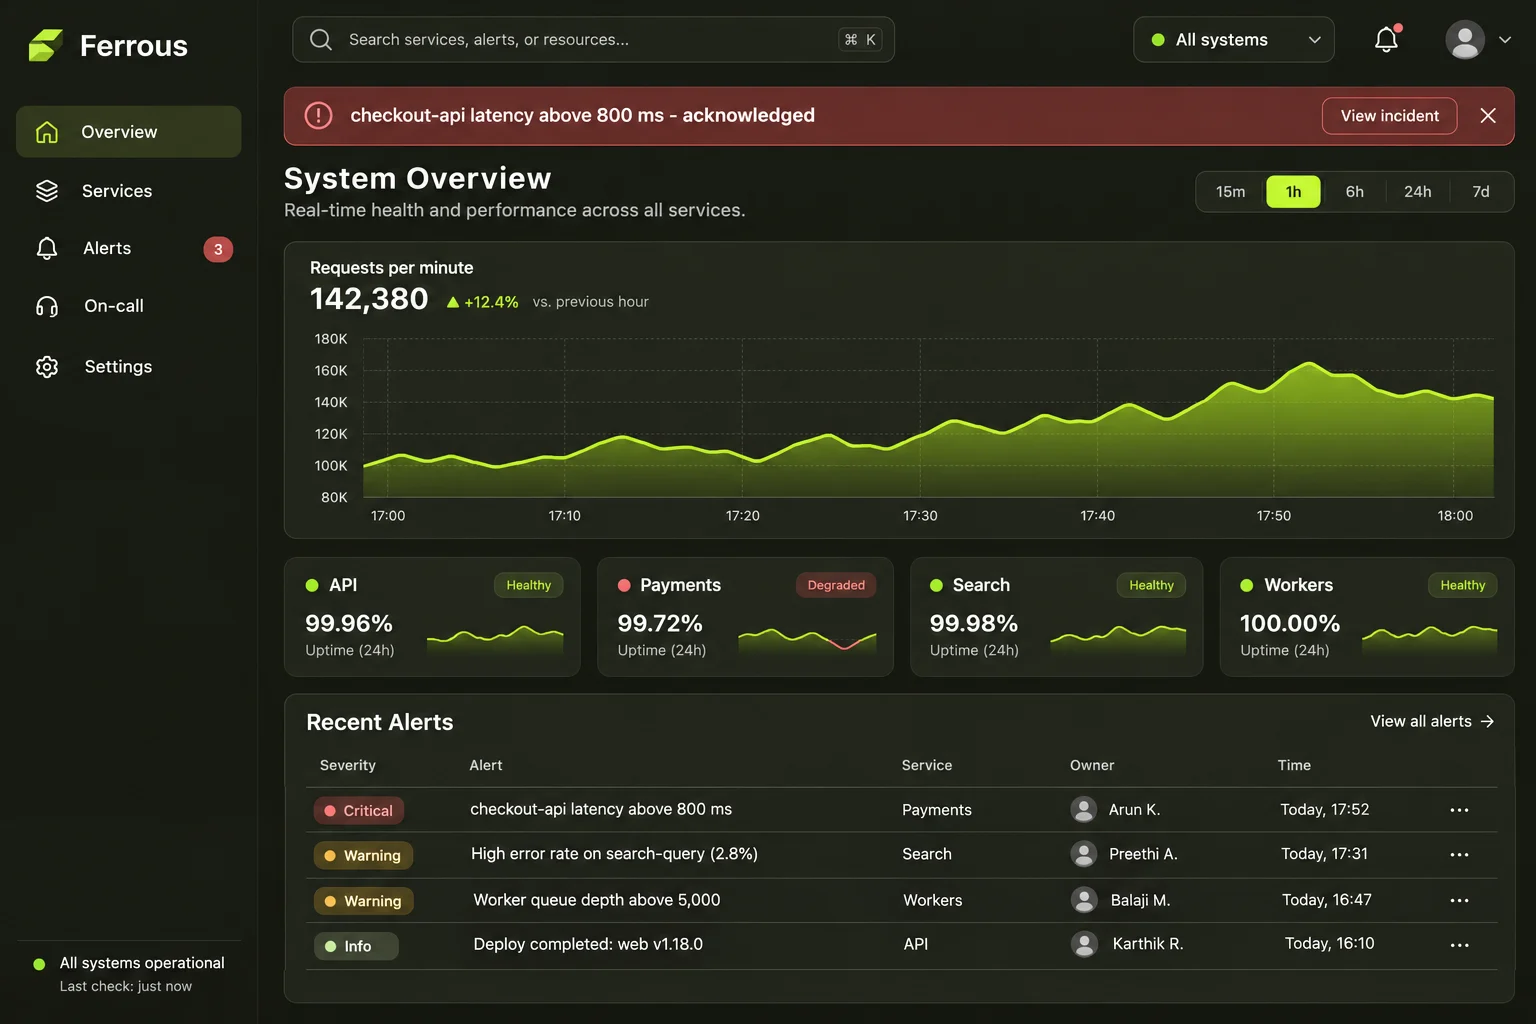
An overview that leads with what is broken
One banner, one chart and four tiles replace thirty panels. Severity, owner and time sit in every alert row.
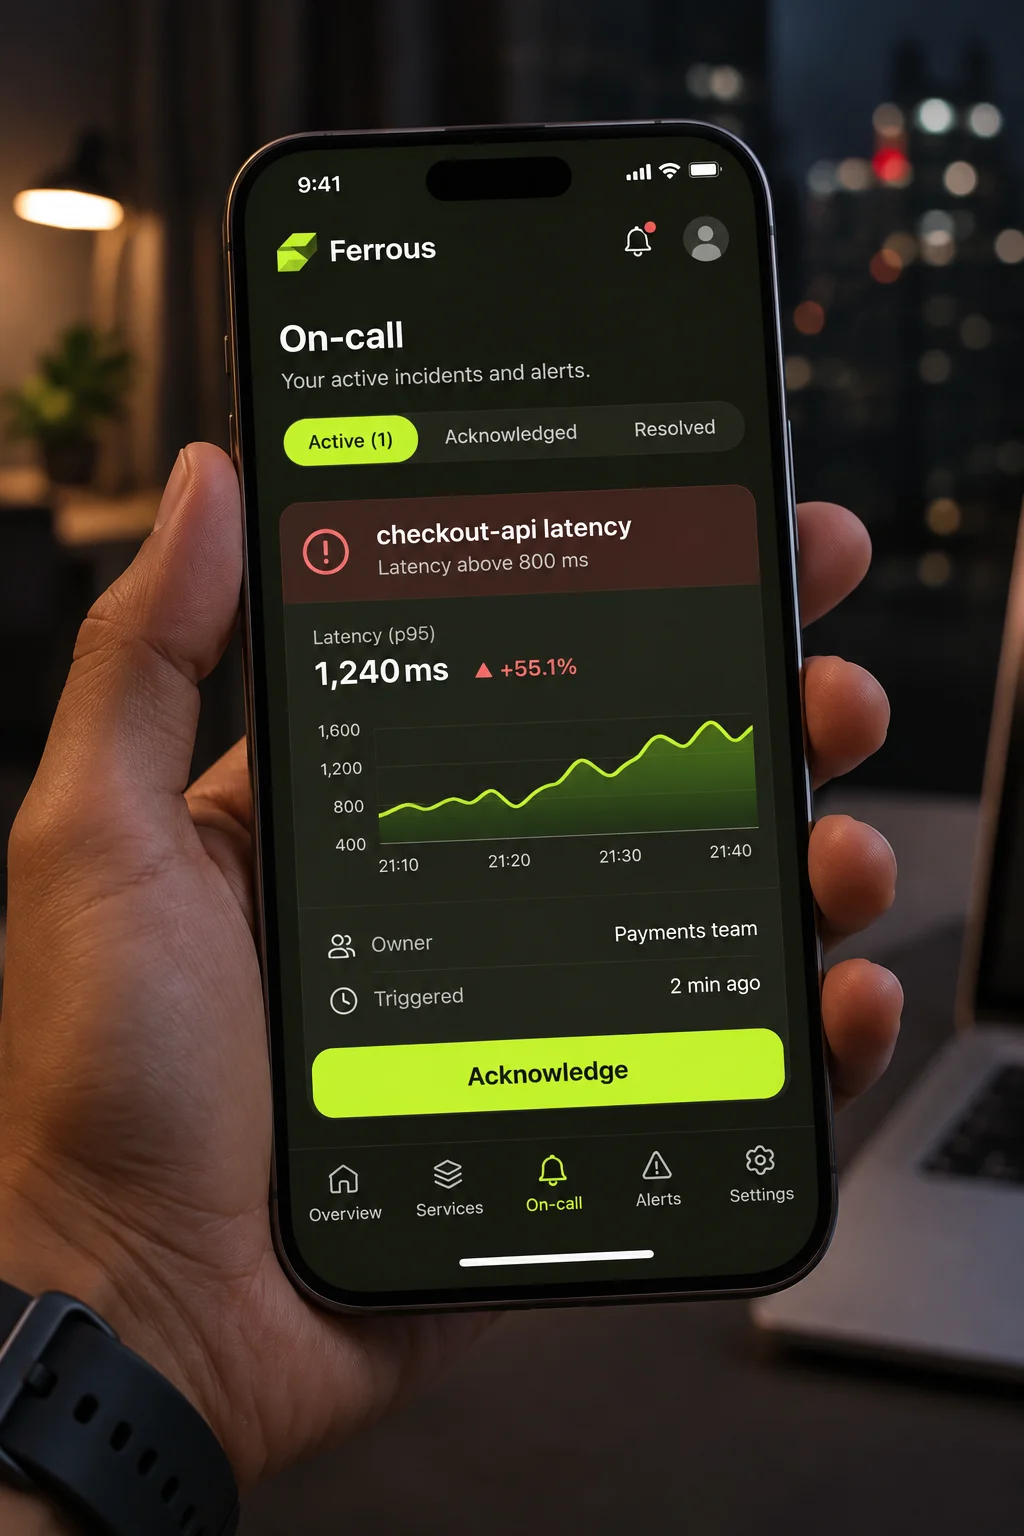
Acknowledge from anywhere
The on-call app opens straight on the alert, with the owner, the graph and one large acknowledge button.
Key decisions
Three decisions that shaped the design
01
Sort by impact
Alerts that affect customers rise to the top, whatever their age.
02
Name the owner
Every service and alert shows its owning team and the person on call.
03
A high-contrast dark theme
Tested at night on dimmed screens; text meets WCAG AA on every panel.
04 · Results
Two months after launch
−48%
time to acknowledge an alert
−35%
alerts escalated to a second engineer
30 → 6
panels on the overview screen
Figures are sample content for this template.
“Our on-call engineers finally trust the console. Iris didn't just redesign it, she shipped it with us, and the new front end is faster to work in too.”
P
Priya Raman
Engineering manager, Ferrous
05 · What I learned
What I would keep for the next project
Design from real incidents
Replaying actual incidents gave us a test for every design decision.
Remove before you add
Cutting panels did more for speed than any new feature.
Ship behind a flag
Running the old and new consoles side by side let teams switch when they were ready.
Next case study
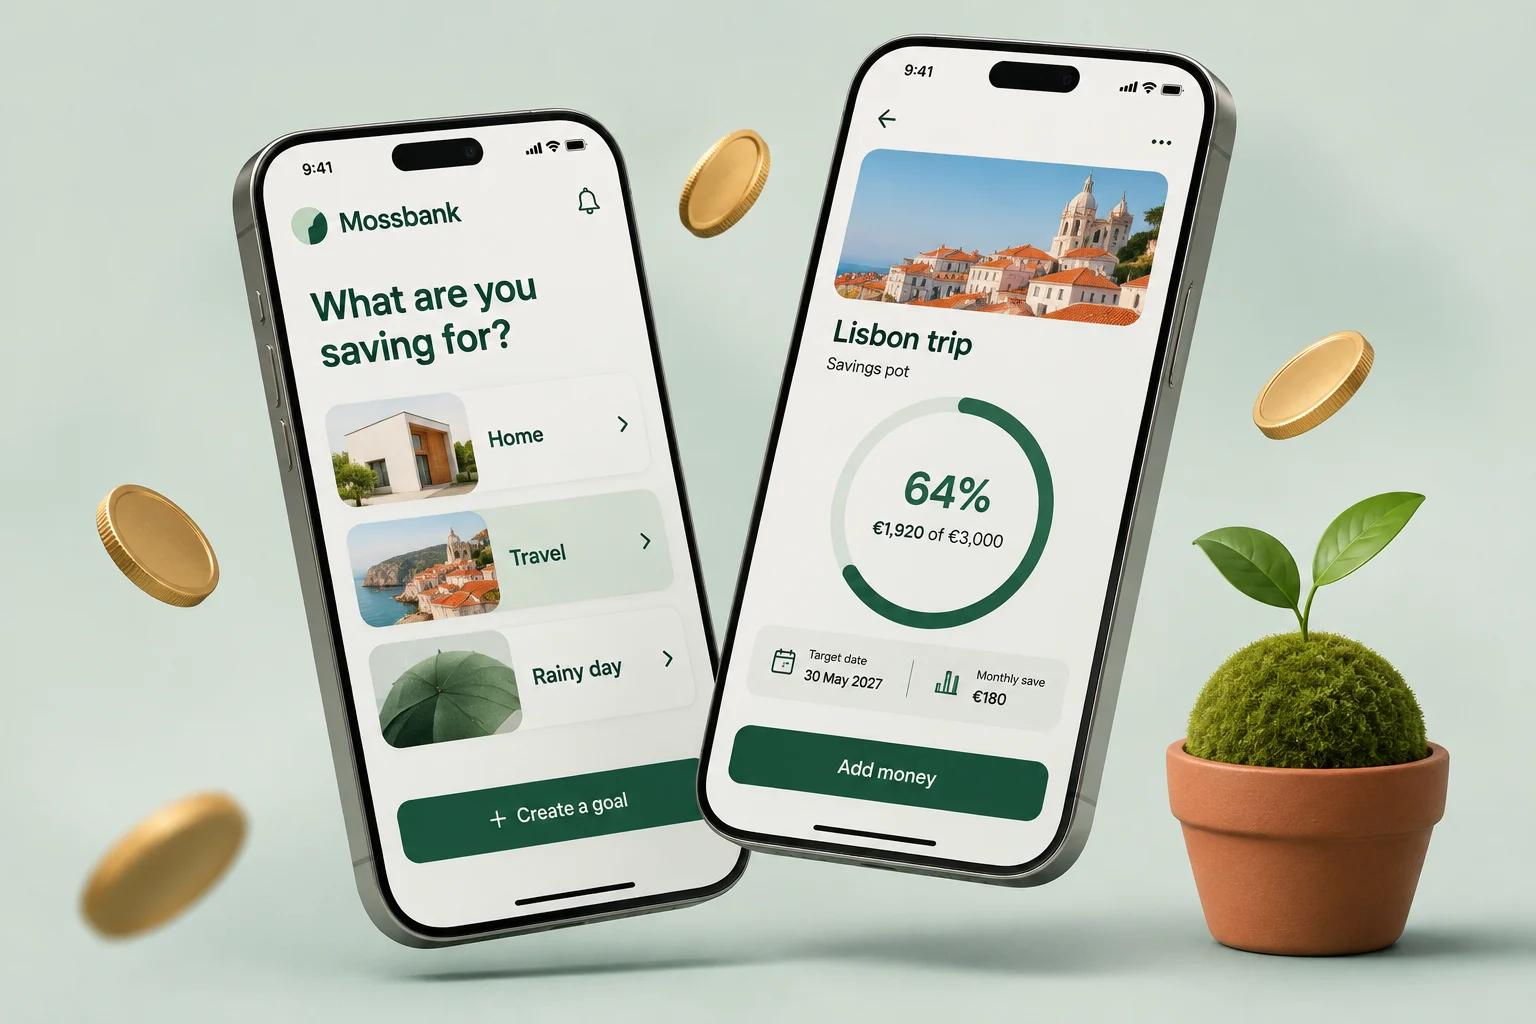
Halving sign-up time for a savings app
Mossbank · Fintech · Onboarding redesign
Next opening · January 2027
Let's build the next one.
Tell me what you're building and when it needs to be live. I take on one build at a time, so I'll be straight with you about timing and fit.

Iris Vane
Usually replies the same day
Reply within one working day
30-minute intro call
Proposal and fixed price in three days
Nothing is payable until you sign.
© 2026 Iris Vane. Projects, clients and figures are sample content.
Back to top ↑