Product design
Product · Seismic data app
Tremor
Live earthquake data and alerts that a non-expert can read in two seconds.
Role
Product designer, data visualisation
Year
2025
Category
Seismic data app
Services
Mobile app, Data visualisation, Onboarding, Alerts
01
The problem
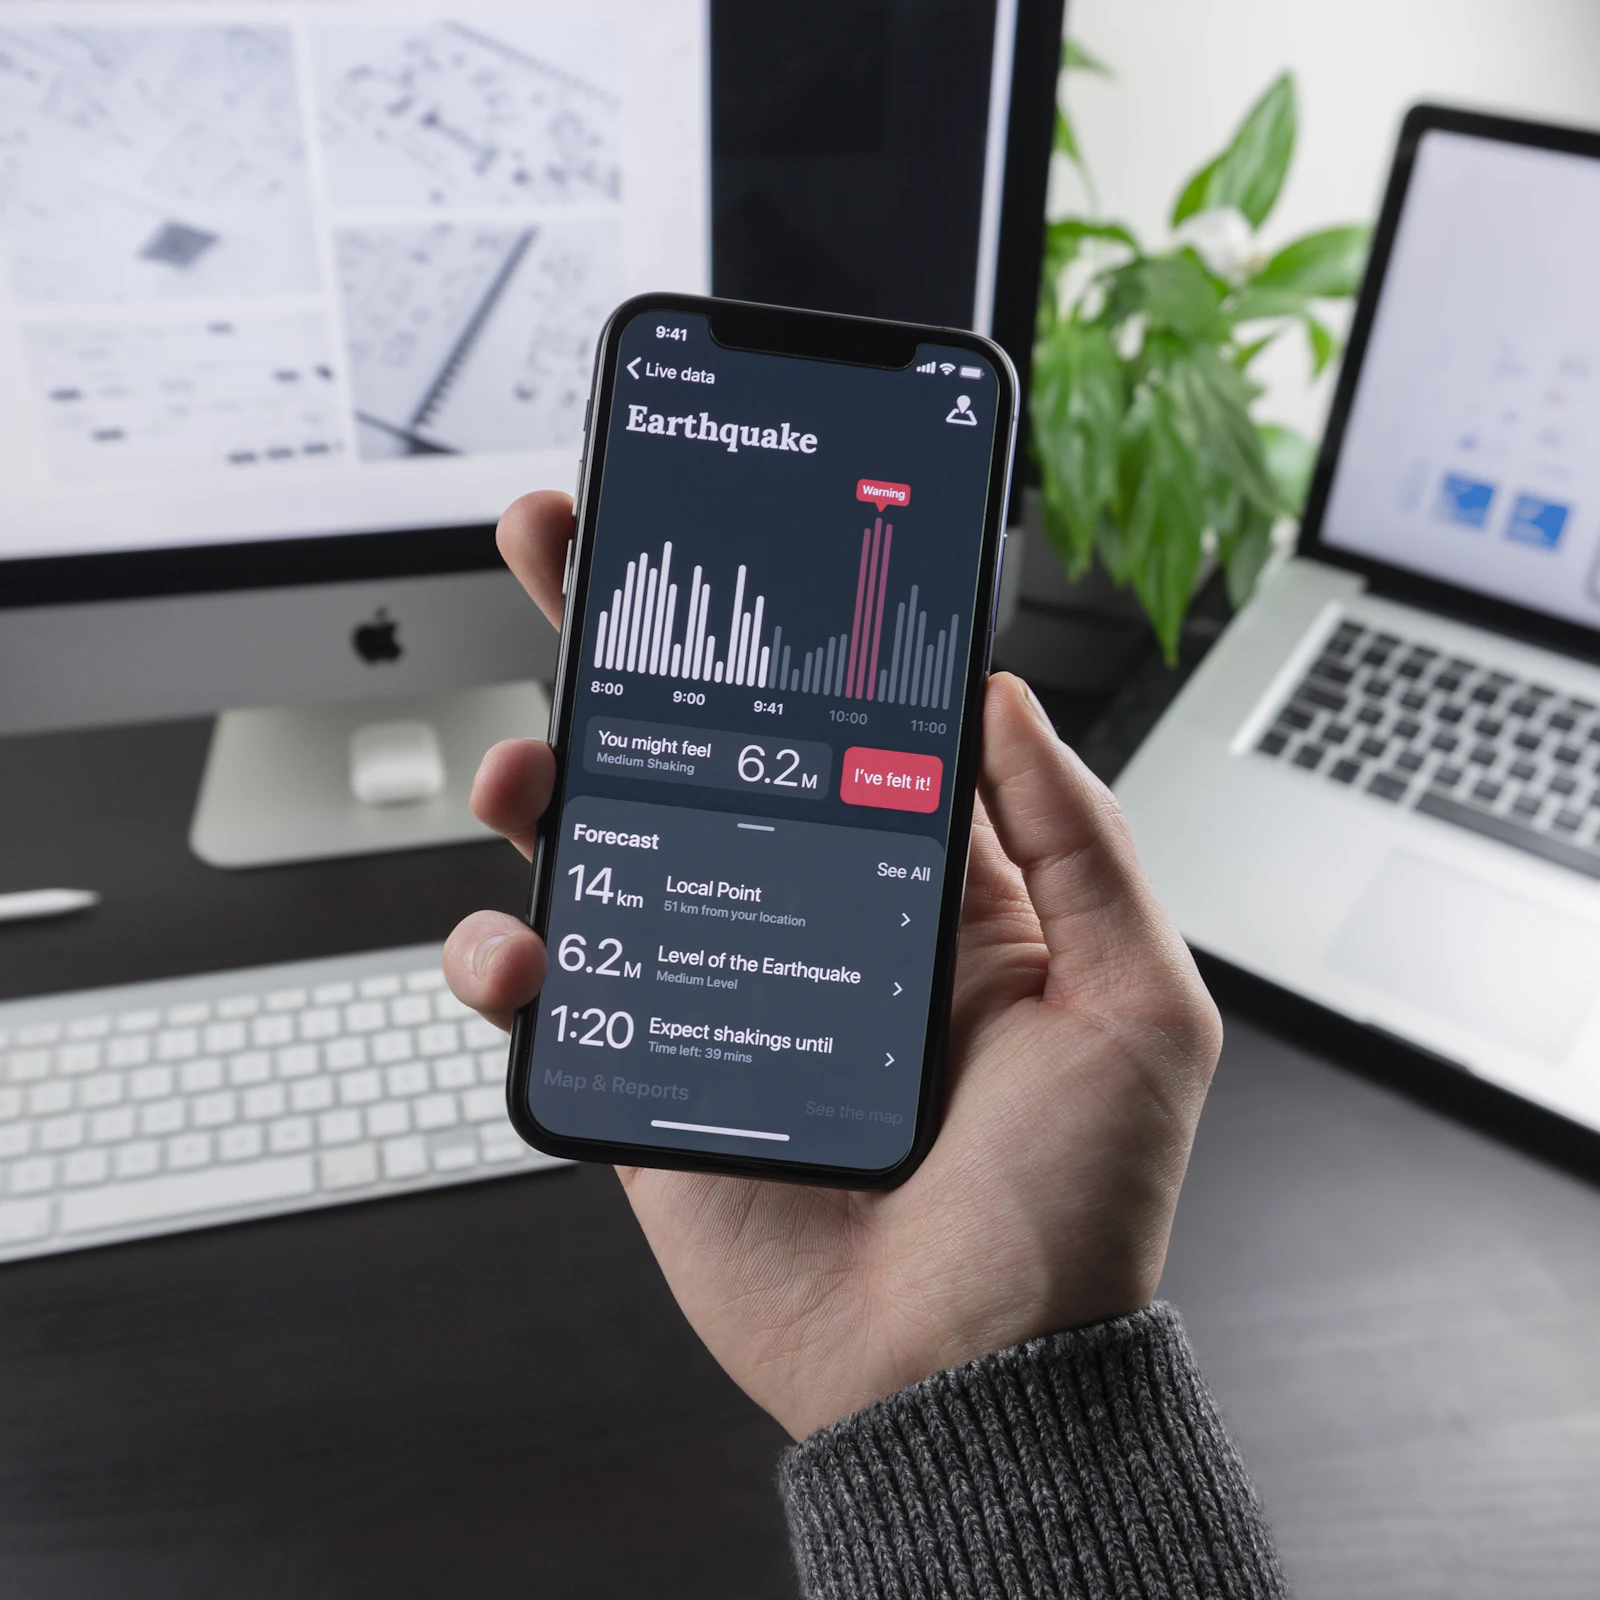
The data was accurate but unreadable: raw magnitudes, depth figures and coordinates in long tables that most people scrolled past.
02
The process
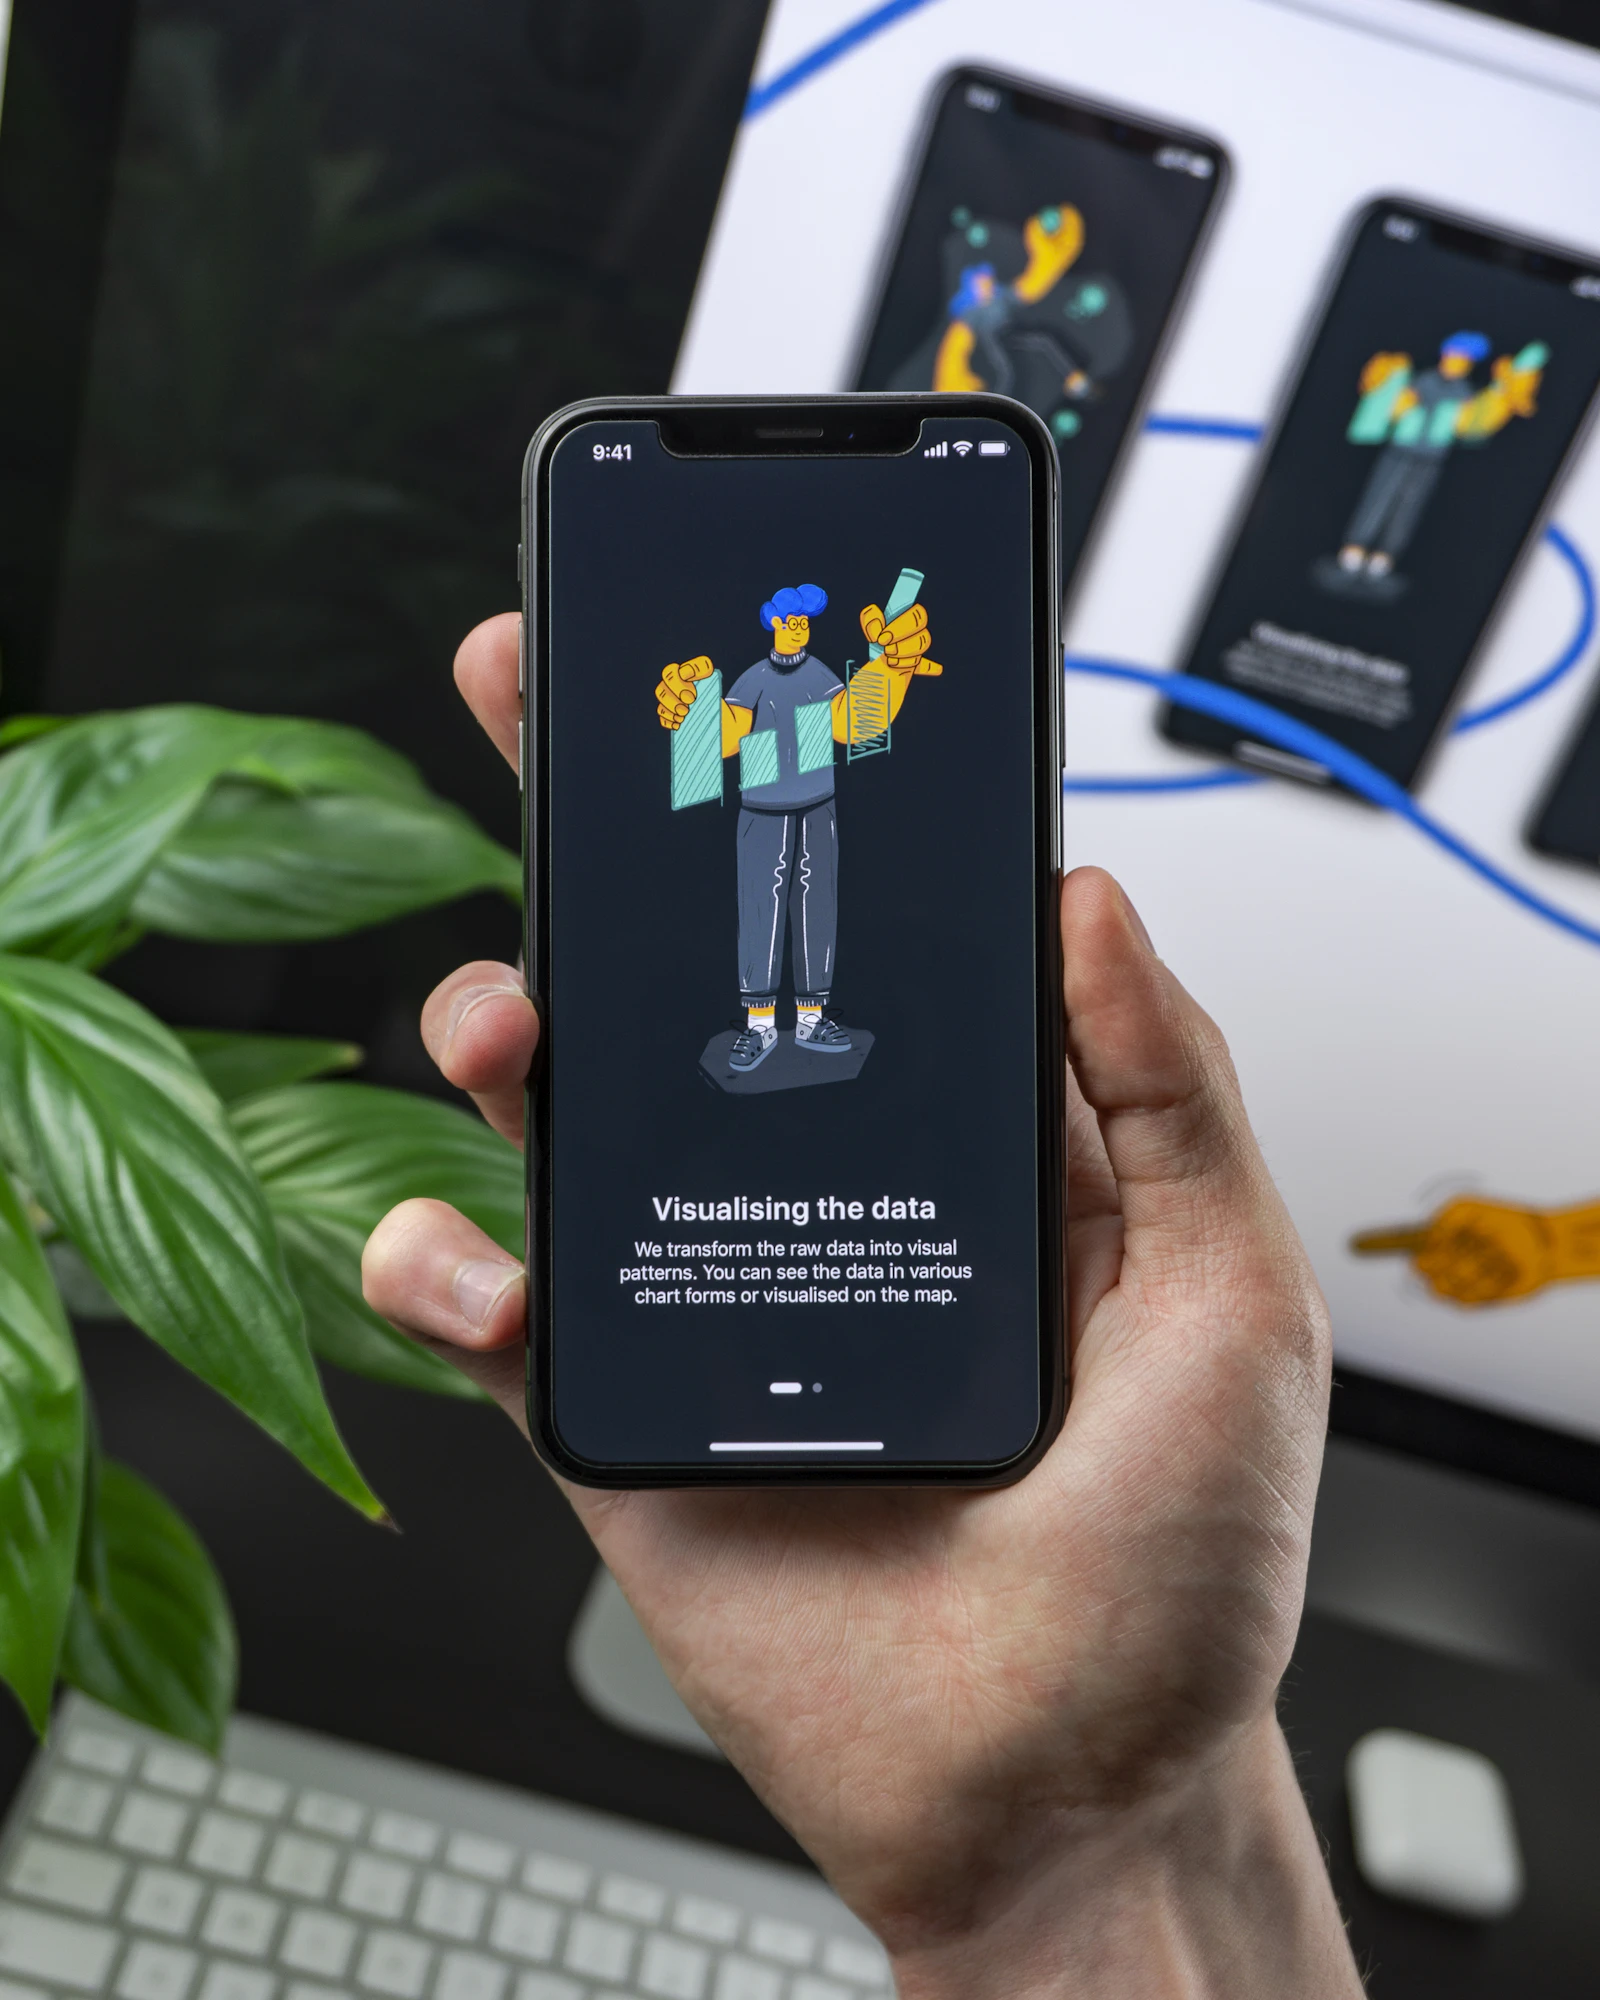
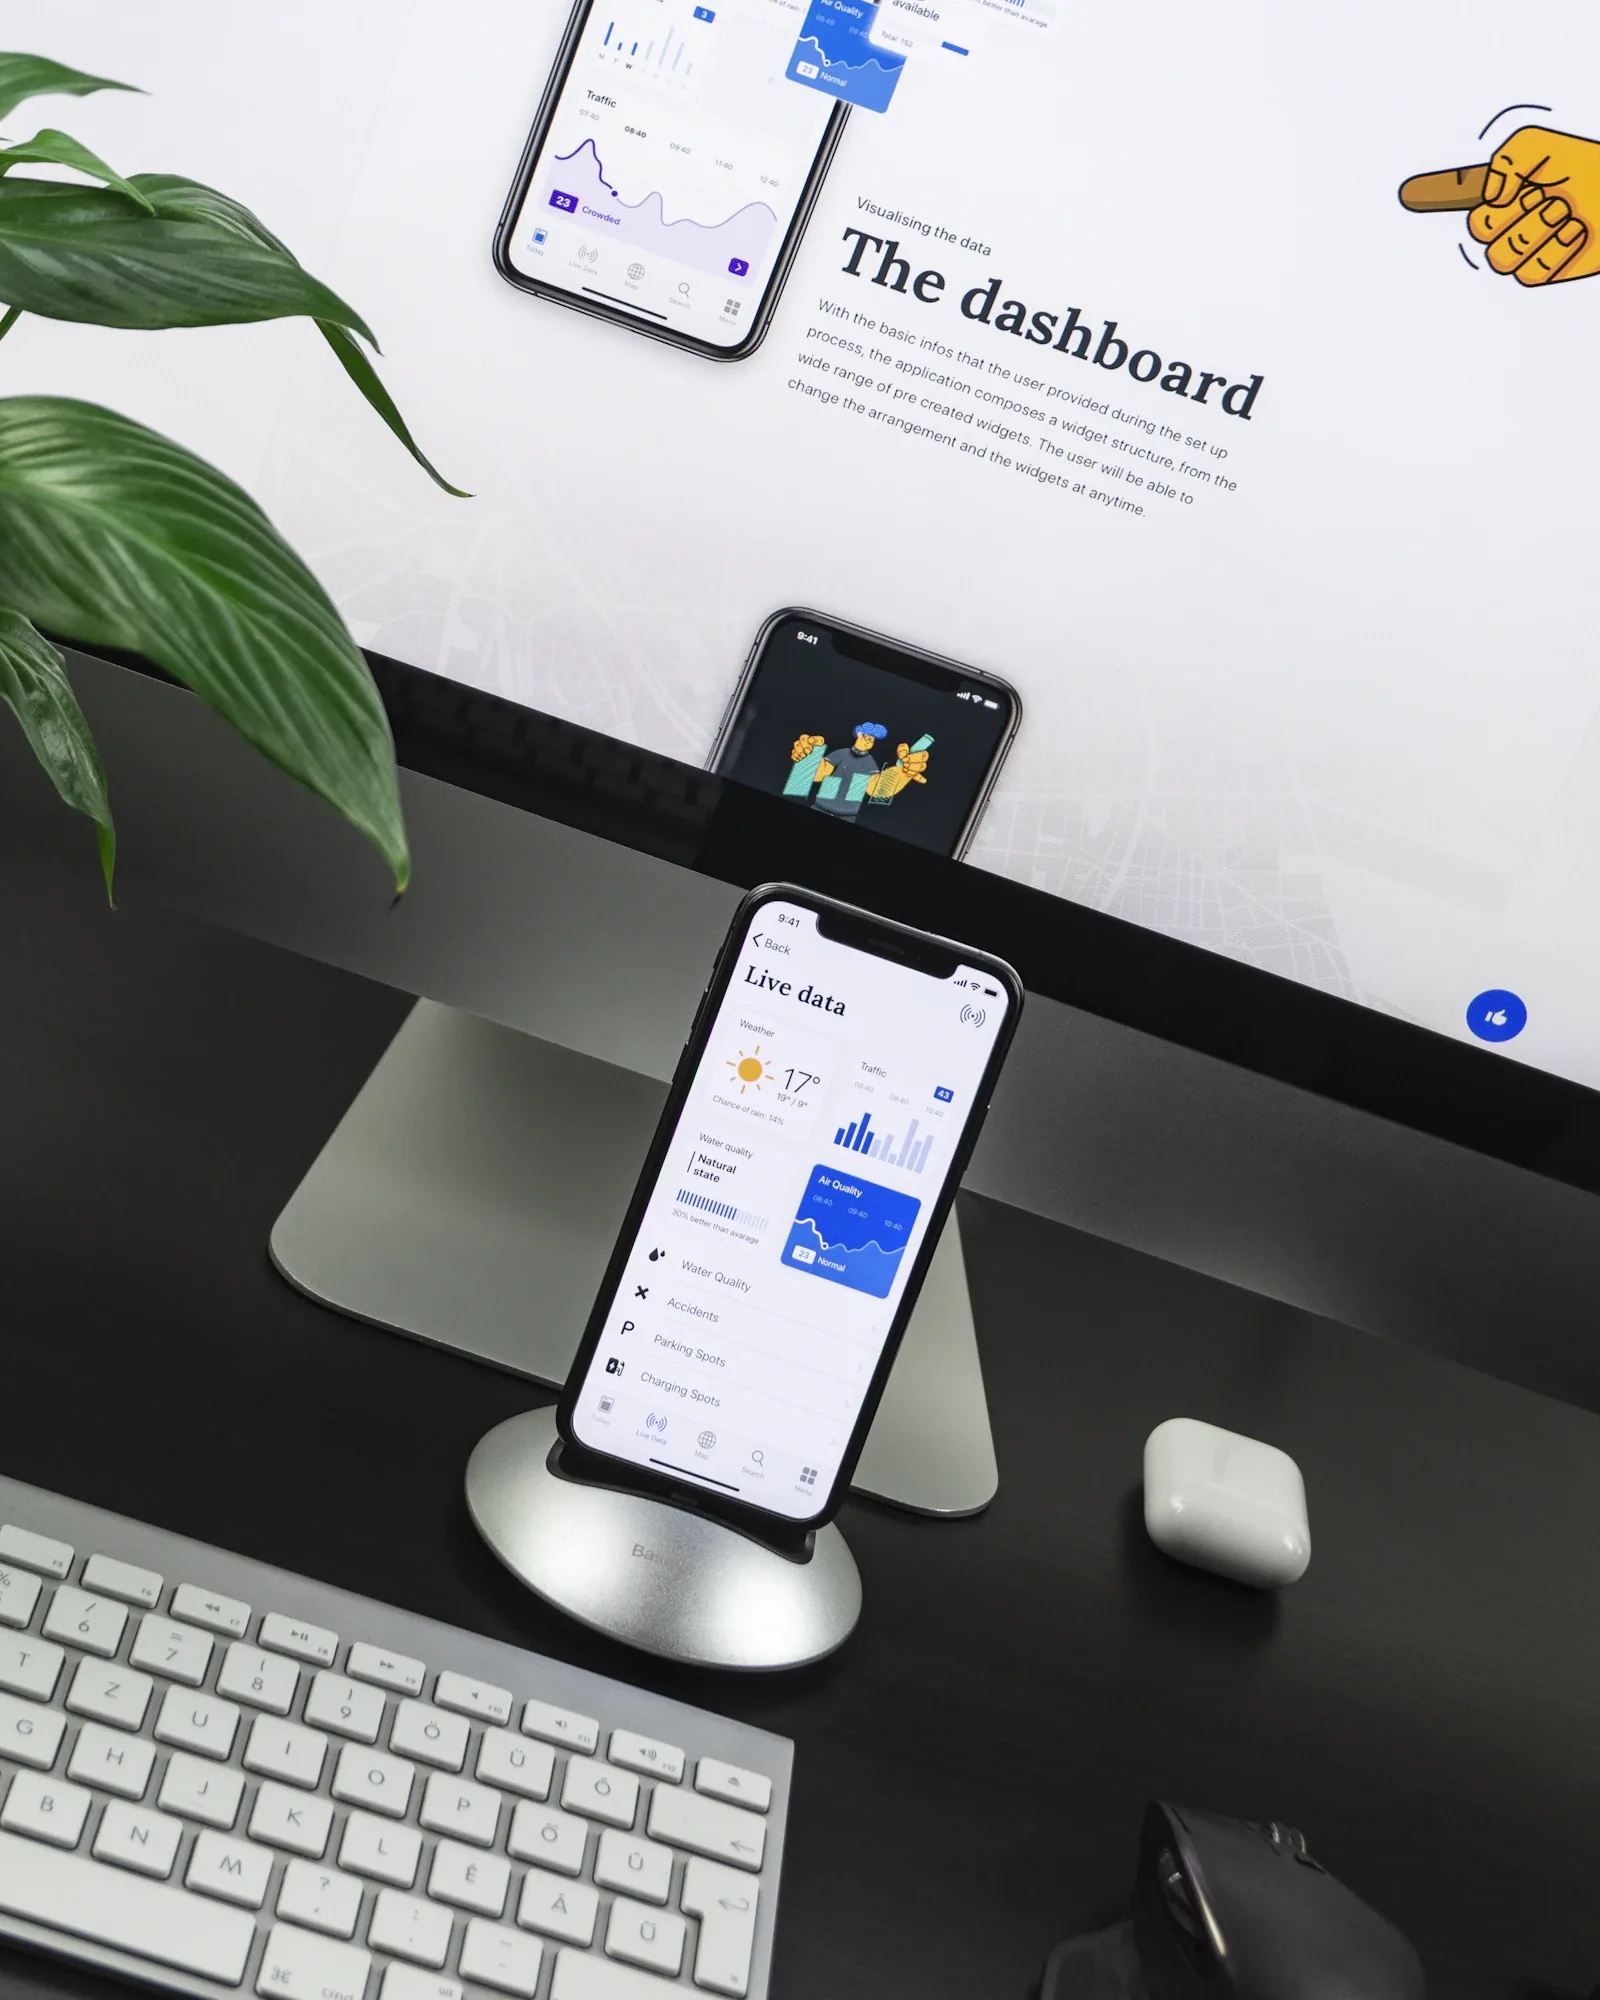
I designed a single timeline chart with clear severity colours, an onboarding that explains magnitude with everyday comparisons, and a lighter “Live data” view for quick checks.
03
The outcome
Testers answered “how close and how strong?” correctly 9 times out of 10, up from fewer than half with the old screens. Figures are sample content.
9/10
testers read an alert correctly
Next project
Componentry
Product · Design system
© 2026 Kit Moreno. Project names, clients and figures are sample content.